The title of this post might seem like a truism, but for about a decade some people have claimed the opposite, and many people have spent much time and effort trying to understand why. Much of that effort was wasted.
A decade ago, Nature Geoscience published Cohen et al (2014), a review paper on potential connections between the Arctic warming and extreme events (which has been cited an impressive 1449 times), which quite sensibly concluded that:
…improved process understanding, sustained and additional Arctic observations, and better coordinated modelling studies will be needed to advance our understanding of the influences on mid-latitude weather and extreme events.
However, within the paper were a couple of graphs that attracted a lot of attention. These were the following, showing northern mid-latitude extreme events from 1950-2013:
The change of trend from the late 1990s onward in the minimum daily average temperature in each winter is striking, and leads Cohen et al to discuss possible mechanisms for these unanticipated results (related to planetary waves, the jet stream etc.).
The data plotted are derivable from the GHCNDEX data available from Climdex. The description paper (Donat et al, 2013) for that data, has the following text:
… spatial coverage is one of the major sources of uncertainty when calculating global trends… Therefore, we recommend that appropriate masks for data completeness should be applied when analyzing time series of area averages.

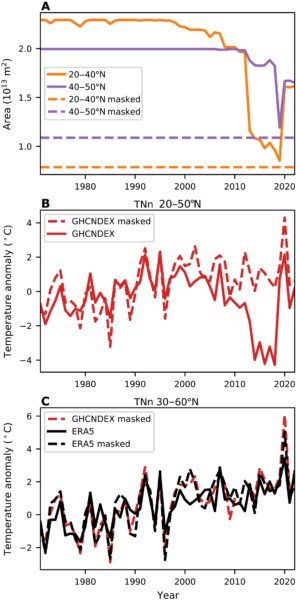
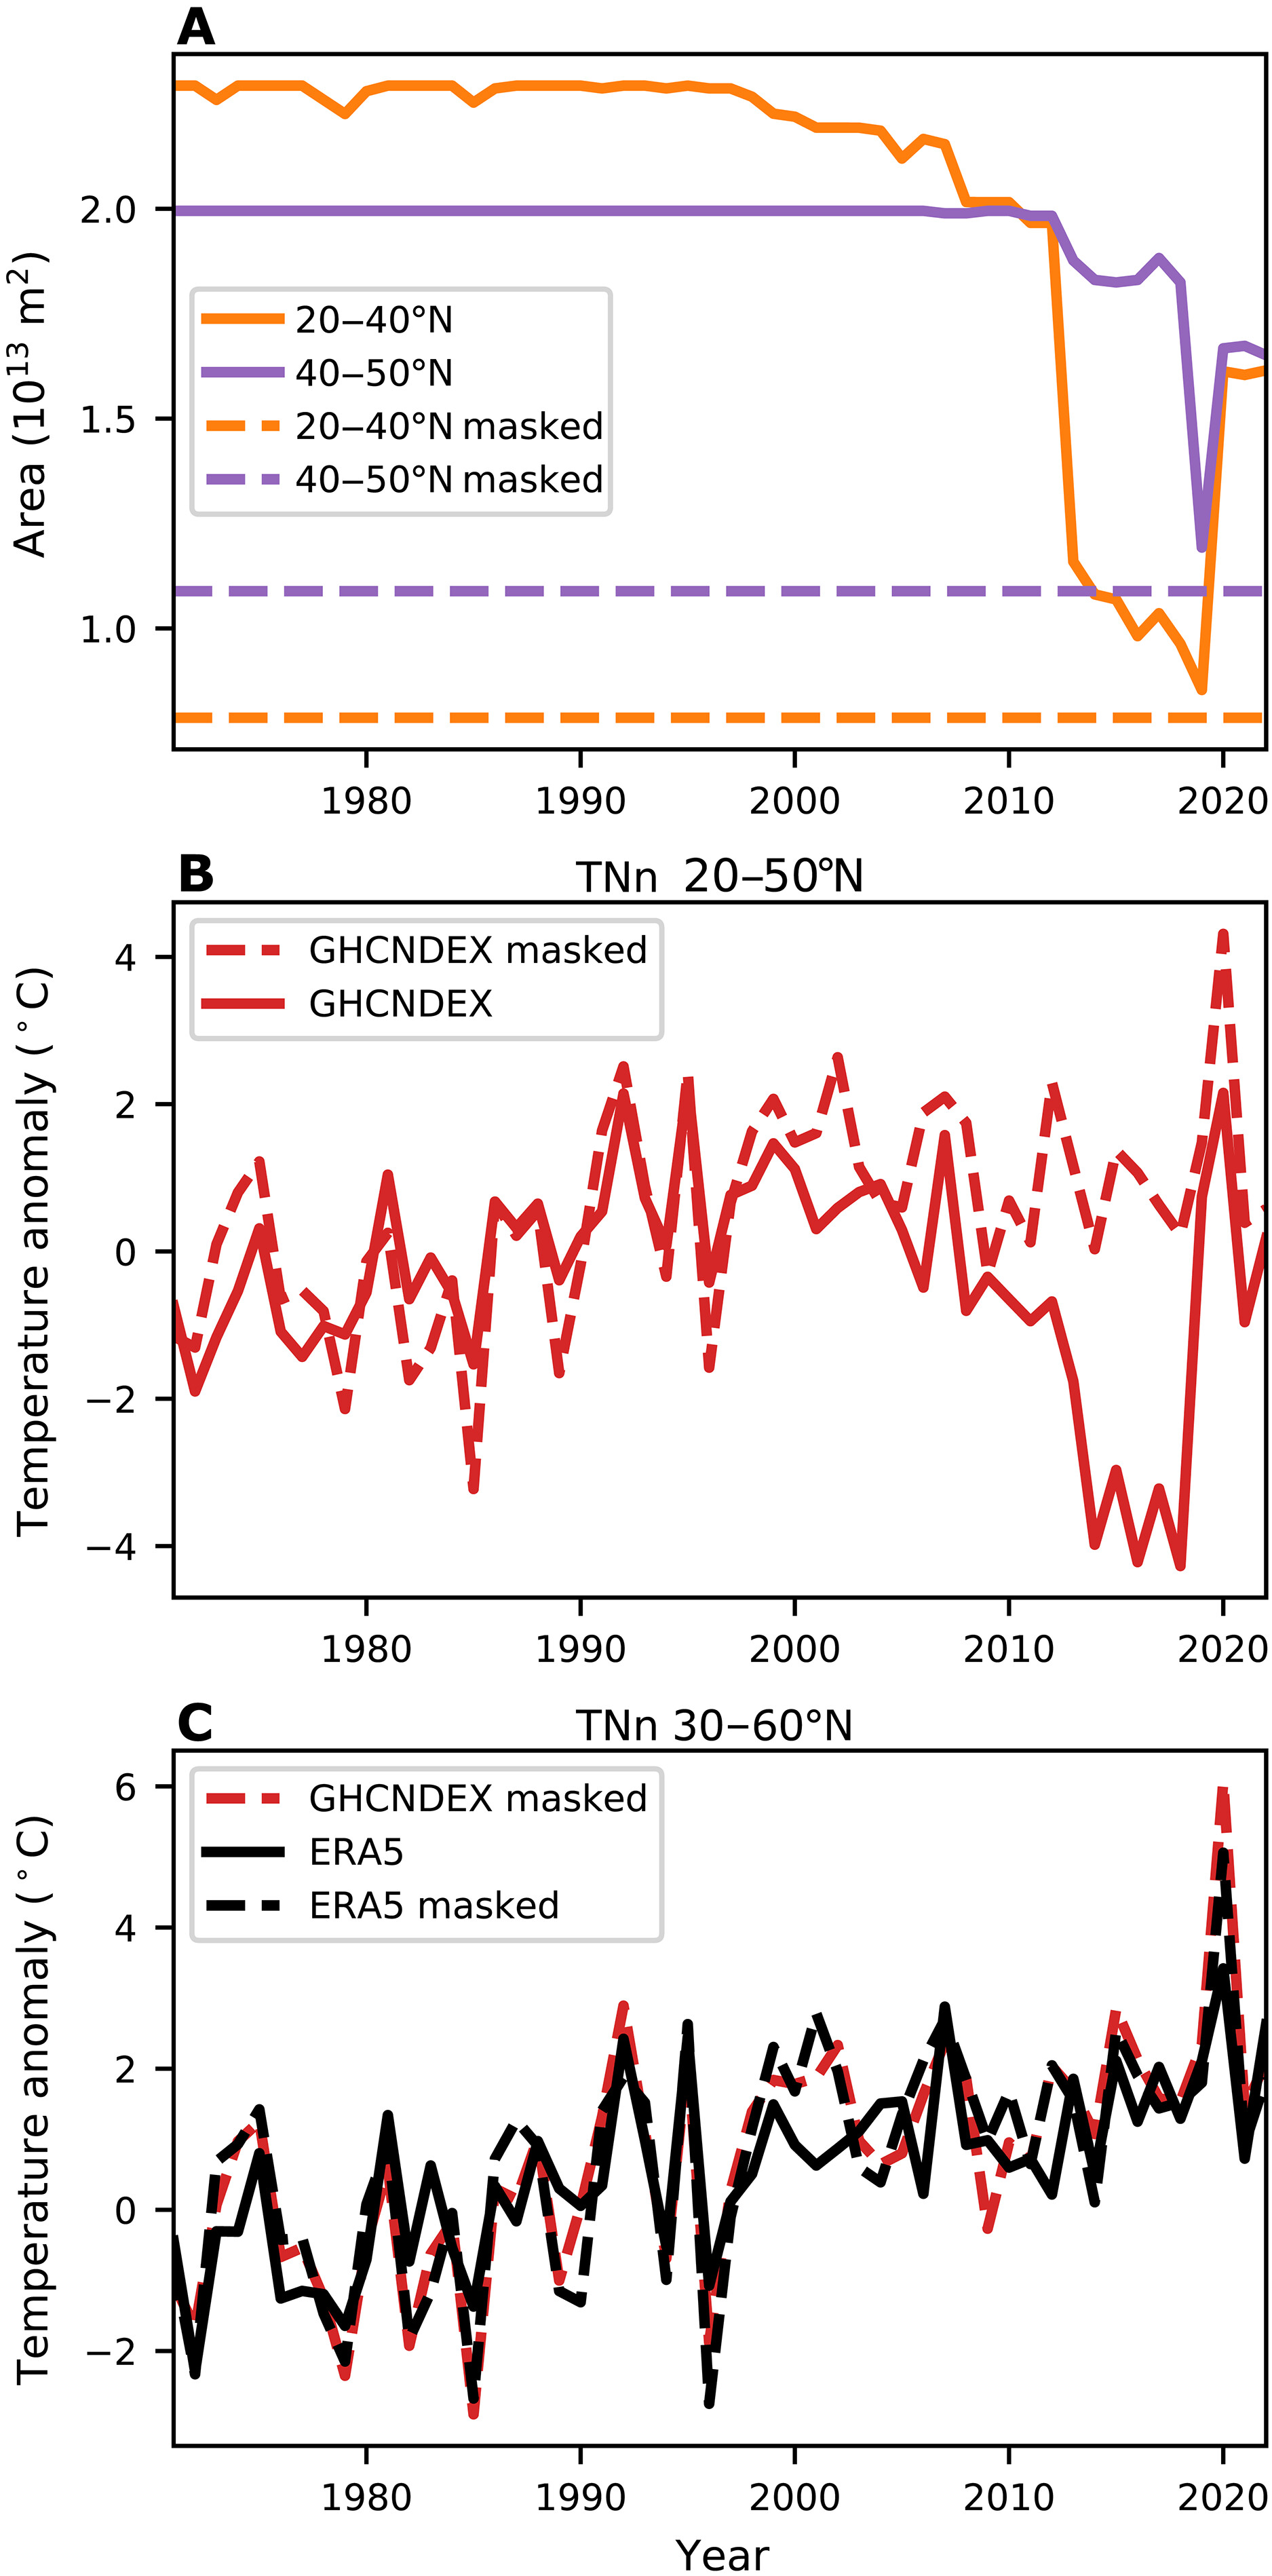
A new paper, Blackport et al (2024) makes it extremely clear that this masking step is essential for the regions looked at by Cohen et al, and without it, the trends are compromised. The demonstration of this is shown on the right. First, Panel A shows that the GHCNDEX data has a very large coverage change – particularly in the 20-40ºN band (an over 50% drop). Applying a common mask over the period allows one to produce a consistent record, and that is done in Panel B. It is clear that the data drop out impacts the 1995-2012 trend, turning a slight positive trend into a large (and spurious) downward trend in line with the results shown by Cohen et al. The addition of ten more years of data confirms the overall story.
As a further confirmation, the masked GHCNDEX changes are an excellent match to the quasi-independent (and spatially complete) data from ERA5. It thus seems indisputable that the implications of the Cohen et al analysis were not valid.
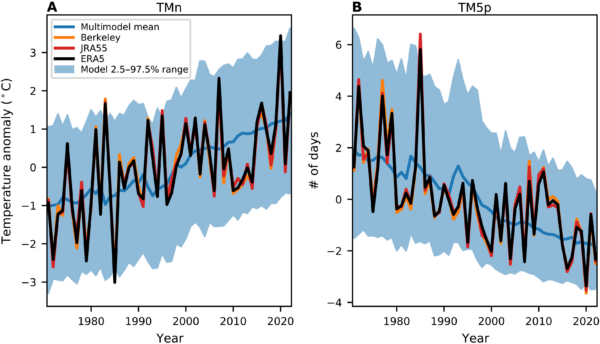
Blackport et al also do a clear analysis of how well models match the (properly handled) observational data. With the corrected data, a multi-model ensemble does a very creditable job at tracking the trends in minimum temperature:

This is nonetheless a quite noisy system, and with short time periods one can find small regions where the trends go the other way (e.g. Cohen et al., 2024), but no recent analyses (that I’ve seen) support the large claims made in the original paper (see also Blackport and Screen (2020)).
It is therefore very likely that there is no mystery to be solved, no huge model-data discrepancy to puzzle over, and no counterintuitive result to set the scientists’ hearts racing.
Unmasking the problem
So what happened here, and why has it taken a decade for clarity to emerge about a result that was spurious at the time? This ties in to one of my frequent themes here related to the replication and reproduction of results. To be clear, scientists sometimes make mistakes, or more often, make assumptions about data that aren’t valid (and I have made my fair share). However, this was an analysis of publicly available data, using a methodology that the originators of the data had already flagged as problematic. Someone should have been able to point out the problems with the original data immediately.
Why didn’t that happen? I can’t say. I do know that the Blackport et al paper was desk-rejected by Nature Geoscience (the original publishers of the Cohen paper) in keeping with the known reluctance of journals to deal with comments and post-publication criticism (even if implicit) of their editorial choices.
Perhaps we still need to do work to build a scientific culture where routine replication and robustness tests are done by many people without the expectation that there is something wrong, but just as a basic check that conclusions are sound, and that discordances between models and observations are real, before we spend a decade looking for solutions to problems that don’t exist.
References
J. Cohen, J.A. Screen, J.C. Furtado, M. Barlow, D. Whittleston, D. Coumou, J. Francis, K. Dethloff, D. Entekhabi, J. Overland, and J. Jones, “Recent Arctic amplification and extreme mid-latitude weather”, Nature Geoscience, vol. 7, pp. 627-637, 2014. http://dx.doi.org/10.1038/ngeo2234
M. Donat, L. Alexander, H. Yang, I. Durre, R. Vose, and J. Caesar, “Global Land-Based Datasets for Monitoring Climatic Extremes”, Bulletin of the American Meteorological Society, vol. 94, pp. 997-1006, 2013. http://dx.doi.org/10.1175/BAMS-D-12-00109.1
R. Blackport, M. Sigmond, and J.A. Screen, “Models and observations agree on fewer and milder midlatitude cold extremes even over recent decades of rapid Arctic warming”, Science Advances, vol. 10, 2024. http://dx.doi.org/10.1126/sciadv.adp1346
J. Cohen, J.A. Francis, and K. Pfeiffer, “Anomalous Arctic warming linked with severe winter weather in Northern Hemisphere continents”, Communications Earth & Environment, vol. 5, 2024. http://dx.doi.org/10.1038/s43247-024-01720-0
R. Blackport, and J.A. Screen, “Weakened evidence for mid-latitude impacts of Arctic warming”, Nature Climate Change, vol. 10, pp. 1065-1066, 2020. http://dx.doi.org/10.1038/s41558-020-00954-y
